

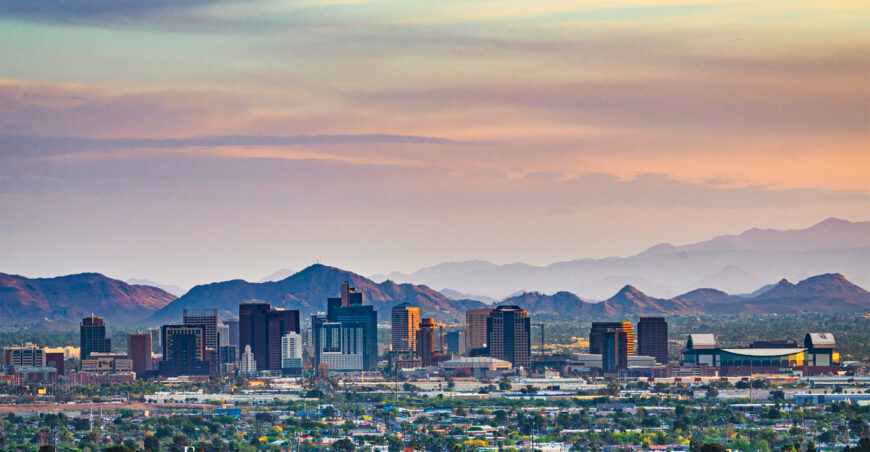
The Phoenix commercial real estate market entered 2026 with a lot of crosscurrents, and the first two quarters have started to sort them out. Comparing Q1 and Q2 side by side is more useful than reading either quarter alone, because a single quarter of absorption can swing on one or two large deals. Across a half-year, the trend lines get honest.
So what actually happened? Three of the four major asset classes — office, industrial, and retail — posted stronger leasing fundamentals in Q2 than in Q1. At the same time, the way deals get priced and financed grew more conservative. Understanding that split is the key to reading the Phoenix commercial real estate market correctly right now, and it changes how investors should think about their next move.
Place Q1 and Q2 side by side and the Greater Phoenix market didn’t soften — its leasing fundamentals actually firmed up, even as buyers and lenders grew more cautious on price. Here are the five takeaways that matter most.
- Office turned the corner. Phoenix office swung from a (267,340) SF absorption loss in Q1 to a +492,625 SF gain in Q2, and asking rents hit an all-time high of $31.65 per square foot.
- Industrial extended its lead. Industrial posted +5.4 million SF of net absorption in Q2 and drove total vacancy down to 11.4%, a 210-basis-point improvement year over year.
- Retail stayed tight but pricing eased. Vacancy held below 5% and rents rose 9.4% year over year, yet cap rates expanded and deal velocity slowed — a sign of pricing discipline, not demand collapse.
- Healthcare is the lagging read. Medical office was the one class showing strain in the most recent published data, with the Q2 update still pending at the time of writing.
- The through-line: a bifurcated market. Occupancy strengthened while capital-markets pricing turned selective — the defining feature of the Phoenix commercial real estate market at mid-year 2026.
Current Market Context
Two forces are pulling in different directions across Greater Phoenix. On the demand side, tenants kept leasing space — driven by advanced manufacturing, logistics, healthcare, and a steady stream of new residents and employers. On the capital side, elevated interest rates and disciplined lender underwriting kept a lid on transaction volume and nudged pricing lower even where fundamentals improved.
That combination explains why headline vacancy can fall while cap rates rise in the same market. Buyers are still competing for well-located assets, but they are paying less per dollar of income than they were a year ago. For owners and investors, the takeaway is that leasing strength and pricing strength are no longer moving in lockstep, and each asset class has to be underwritten on its own merits.
Phoenix Commercial Real Estate Market: Q1 vs. Q2 2026 and What It Means for Tenants, Investors, and Brokers
Here is the asset-by-asset comparison that defines the Phoenix commercial real estate market at the midpoint of 2026.
Office: From Losses to a Record
Office was the biggest mover. In Q1, the Phoenix office market gave back (267,340) SF of space with total vacancy at 24.0%. In Q2, it reversed course entirely, absorbing +492,625 SF as every property class posted gains and vacancy improved to 23.3%. Direct asking rents climbed to an all-time market high of $31.65 per square foot on a full-service basis, with Class A commanding $34.59. Sublet space — a drag on the market for two years — started clearing, accounting for more than half of Class A’s net absorption.
What it means. For tenants — With total vacancy at 23.3% and Class A vacancy at 28.1%, occupiers still hold leverage and choice — but the best-amenitized Class A space in Scottsdale Airpark and the Camelback/Scottsdale cores is tightening at record rents, so lock in terms on premium space sooner rather than later; value seekers can still find real discounts in suburban Class B/C. For investors — The swing to positive absorption plus record rents signals stabilization, not full recovery — target amenitized Class A with active spec-suite programs and underwrite suburban Class B/C at meaningful discounts to historical norms. For brokers — Sell the bifurcation story: headline vacancy is high, but sublet space is clearing and move-in-ready spec suites are leasing — position deals around amenitized, ready space and flag pricing resistance in top submarkets like Camelback Corridor.
Industrial: Still the Engine
Industrial remained the strongest class in the Phoenix commercial real estate market, and it got stronger. The Phoenix industrial market absorbed +4.4 million SF in Q1 and then +5.4 million SF in Q2, pushing total vacancy down to 11.4% from 12.4%. New deliveries fell 66% year to date, which means demand is now outrunning new supply — a setup that favors landlords into 2027. Glendale alone drove nearly the entire quarter’s absorption, powered by semiconductor and advanced-manufacturing users.
What it means. For tenants — Space is tightening and new deliveries are down 66% — users who need bulk space should move ahead of 2027, when the supply-demand balance tips further toward landlords; today’s softer pockets (Southwest of Buckeye Rd, Tolleson, Tempe Southwest) still offer negotiating room. For investors — The strongest asset class — target well-located second-generation bulk product in Goodyear, Glendale, and Chandler at roughly $105–$150/SF, while sizing Glendale’s concentration risk (it carries both the demand and 4.31M SF of the pipeline). For brokers — Momentum is real but concentrated — steer requirements toward tightening East Valley and Deer Valley product and set realistic lease-up expectations in the West Valley.
Retail: Tight Space, Softer Pricing
Retail is where the “stronger but more cautious” story is clearest. The Phoenix retail market held vacancy at 4.5% — among the tightest in the Sun Belt — and rents rose 9.4% year over year to $1.78 per square foot per month. But average cap rates expanded from 6.1% to 6.5% and net absorption is running well below last year’s pace. In plain terms: space is still leasing, but investors are paying less for the income stream than they were twelve months ago.
What it means. For tenants — This is the tightest market in the Sun Belt — sub-5% vacancy and 9.4% rent growth leave retail tenants little leverage, so secure renewals early and move on new grocery-anchored space before rents climb further. For investors — Wider cap rates (up 40 bps to 6.5%) paired with tight vacancy and rising rents are an entry point, not a warning — target grocery-anchored, necessity-based centers in high-growth East and West Valley submarkets at 6.0–6.5% going-in. For brokers — Leasing is firmly landlord-favorable; on the investment side, the widening bid-ask is your opening to bring priced-right necessity retail to buyers hunting for durable income.
Healthcare and Medical Office: The Lagging Class
Medical office was the exception to the improving trend. The most recent published data showed direct vacancy rising to 15.8% and net absorption turning negative, with the Q2 update still pending at the time of writing. The structural case for Phoenix medical office — aging demographics, the shift to outpatient care, and sticky clinical tenants — remains firmly in place, but the near-term read calls for pricing discipline, especially on off-campus assets.
What it means. For tenants — For medical practices, the tightest submarkets — Glendale, Scottsdale South, Tempe, and Arrowhead — leave little room for small-bay clinical users, so plan renewals and expansions well ahead; softer submarkets carry more availability. For investors — The one class showing near-term strain in the latest read — hold pricing discipline, favor Class A on- and near-campus space anchored by investment-grade health systems at 5.5–6.5% cap rates, and wait for the Q2 data before repricing. For brokers — Lead with the structural demand story — aging demographics, outpatient migration, and sticky clinical tenancy — while flagging the data lag; small-bay space in tight submarkets is the easiest match to make.
Local Arizona Impact: Why Greater Phoenix Keeps Growing
The reason all of this matters is that Phoenix isn’t a normal market — it’s one of the fastest-growing metros in the country. Maricopa County ranks among the national leaders for numeric population growth — third nationally among populous counties in the latest Census estimates. New rooftops drive retail demand, new employers drive office and industrial leasing, and an aging population drives medical office demand.
The semiconductor boom is the single biggest catalyst. Arizona ranks #1 nationally for semiconductor industry expansions, backed by more than $195 billion in announced international investment, and TSMC continues to expand its Valley campus. The state also opened a Taiwan Trade and Investment Service Center in Phoenix this year — reinforcing a supply chain that is reshaping the West Valley industrial corridors and pulling office, retail, and housing demand along with it.
You can see the ripple effects in projects like Halo Vista, the $7 billion, 2,300-acre innovation district being built adjacent to TSMC’s expanding campus. Layer in a Phoenix metro unemployment rate in the low-4% range and you have the demographic and employment engine that keeps the Phoenix commercial real estate market resilient even when national capital markets tighten.
National Impact: Phoenix Against the Backdrop
Nationally, commercial real estate is still working through the highest interest-rate environment in a generation. Office markets in many gateway cities remain stuck with structural vacancy, industrial is normalizing after a historic run, and retail is benefiting from years of limited new construction. Phoenix sits favorably against all three trends: its office recovery is ahead of many peer metros, its industrial demand is anchored by manufacturing rather than speculative logistics, and its retail supply is genuinely constrained.
The result is that national capital continues to view Greater Phoenix as a magnet market — a place drawing people, jobs, and companies out of higher-cost metros. That national interest is exactly why local pricing has stayed competitive even as cap rates drifted up across the country.
Key Risks to Watch
- Interest rates and financing. Elevated rates continue to pressure valuations and reduce buyer leverage across every asset class.
- Office durability. Q2’s positive absorption is one strong quarter against 23.3% vacancy. A single soft quarter would reopen questions about the recovery’s staying power.
- Industrial concentration. Glendale is driving the bulk of industrial demand while also carrying the largest construction pipeline — a single-submarket engine is also a single-submarket lease-up risk.
- Retail demand normalization. Vacancy is tight, but absorption is slowing sharply from last year’s pace, and cap rates are expanding.
- Medical office lag. The most recent MOB read was negative and the Q2 data is not yet out — underwriting off stale figures carries timing risk.
Key Opportunities
- Class A office with amenities. Well-located, amenitized Class A product with spec-suite programs in Scottsdale Airpark and the Camelback/Scottsdale cores is capturing the occupancy gains.
- Second-generation industrial. Well-located bulk product in the Goodyear, Glendale, and Chandler corridors at roughly $105–$150 per square foot fits a tightening supply picture.
- Necessity retail. Grocery-anchored neighborhood centers in high-growth East Valley and West Valley submarkets, where wider cap rates create a better entry point on durable income.
The Phoenix commercial real estate market entered 2026 with a lot of crosscurrents, and the first two quarters have started to sort them out. Comparing Q1 and Q2 side by side is more useful than reading either quarter alone, because a single quarter of absorption can swing on one or two large deals. Across a half-year, the trend lines get honest.
So what actually happened? Three of the four major asset classes — office, industrial, and retail — posted stronger leasing fundamentals in Q2 than in Q1. At the same time, the way deals get priced and financed grew more conservative. Understanding that split is the key to reading the Phoenix commercial real estate market correctly right now, and it changes how investors should think about their next move.
Place Q1 and Q2 side by side and the Greater Phoenix market didn’t soften — its leasing fundamentals actually firmed up, even as buyers and lenders grew more cautious on price. Here are the five takeaways that matter most.
- Office turned the corner. Phoenix office swung from a (267,340) SF absorption loss in Q1 to a +492,625 SF gain in Q2, and asking rents hit an all-time high of $31.65 per square foot.
- Industrial extended its lead. Industrial posted +5.4 million SF of net absorption in Q2 and drove total vacancy down to 11.4%, a 210-basis-point improvement year over year.
- Retail stayed tight but pricing eased. Vacancy held below 5% and rents rose 9.4% year over year, yet cap rates expanded and deal velocity slowed — a sign of pricing discipline, not demand collapse.
- Healthcare is the lagging read. Medical office was the one class showing strain in the most recent published data, with the Q2 update still pending at the time of writing.
- The through-line: a bifurcated market. Occupancy strengthened while capital-markets pricing turned selective — the defining feature of the Phoenix commercial real estate market at mid-year 2026.
Current Market Context
Two forces are pulling in different directions across Greater Phoenix. On the demand side, tenants kept leasing space — driven by advanced manufacturing, logistics, healthcare, and a steady stream of new residents and employers. On the capital side, elevated interest rates and disciplined lender underwriting kept a lid on transaction volume and nudged pricing lower even where fundamentals improved.
That combination explains why headline vacancy can fall while cap rates rise in the same market. Buyers are still competing for well-located assets, but they are paying less per dollar of income than they were a year ago. For owners and investors, the takeaway is that leasing strength and pricing strength are no longer moving in lockstep, and each asset class has to be underwritten on its own merits.
Phoenix Commercial Real Estate Market: Q1 vs. Q2 2026 and What It Means for Tenants, Investors, and Brokers
Here is the asset-by-asset comparison that defines the Phoenix commercial real estate market at the midpoint of 2026.
Office: From Losses to a Record
Office was the biggest mover. In Q1, the Phoenix office market gave back (267,340) SF of space with total vacancy at 24.0%. In Q2, it reversed course entirely, absorbing +492,625 SF as every property class posted gains and vacancy improved to 23.3%. Direct asking rents climbed to an all-time market high of $31.65 per square foot on a full-service basis, with Class A commanding $34.59. Sublet space — a drag on the market for two years — started clearing, accounting for more than half of Class A’s net absorption.
What it means. For tenants — With total vacancy at 23.3% and Class A vacancy at 28.1%, occupiers still hold leverage and choice — but the best-amenitized Class A space in Scottsdale Airpark and the Camelback/Scottsdale cores is tightening at record rents, so lock in terms on premium space sooner rather than later; value seekers can still find real discounts in suburban Class B/C. For investors — The swing to positive absorption plus record rents signals stabilization, not full recovery — target amenitized Class A with active spec-suite programs and underwrite suburban Class B/C at meaningful discounts to historical norms. For brokers — Sell the bifurcation story: headline vacancy is high, but sublet space is clearing and move-in-ready spec suites are leasing — position deals around amenitized, ready space and flag pricing resistance in top submarkets like Camelback Corridor.
Industrial: Still the Engine
Industrial remained the strongest class in the Phoenix commercial real estate market, and it got stronger. The Phoenix industrial market absorbed +4.4 million SF in Q1 and then +5.4 million SF in Q2, pushing total vacancy down to 11.4% from 12.4%. New deliveries fell 66% year to date, which means demand is now outrunning new supply — a setup that favors landlords into 2027. Glendale alone drove nearly the entire quarter’s absorption, powered by semiconductor and advanced-manufacturing users.
What it means. For tenants — Space is tightening and new deliveries are down 66% — users who need bulk space should move ahead of 2027, when the supply-demand balance tips further toward landlords; today’s softer pockets (Southwest of Buckeye Rd, Tolleson, Tempe Southwest) still offer negotiating room. For investors — The strongest asset class — target well-located second-generation bulk product in Goodyear, Glendale, and Chandler at roughly $105–$150/SF, while sizing Glendale’s concentration risk (it carries both the demand and 4.31M SF of the pipeline). For brokers — Momentum is real but concentrated — steer requirements toward tightening East Valley and Deer Valley product and set realistic lease-up expectations in the West Valley.
Retail: Tight Space, Softer Pricing
Retail is where the “stronger but more cautious” story is clearest. The Phoenix retail market held vacancy at 4.5% — among the tightest in the Sun Belt — and rents rose 9.4% year over year to $1.78 per square foot per month. But average cap rates expanded from 6.1% to 6.5% and net absorption is running well below last year’s pace. In plain terms: space is still leasing, but investors are paying less for the income stream than they were twelve months ago.
What it means. For tenants — This is the tightest market in the Sun Belt — sub-5% vacancy and 9.4% rent growth leave retail tenants little leverage, so secure renewals early and move on new grocery-anchored space before rents climb further. For investors — Wider cap rates (up 40 bps to 6.5%) paired with tight vacancy and rising rents are an entry point, not a warning — target grocery-anchored, necessity-based centers in high-growth East and West Valley submarkets at 6.0–6.5% going-in. For brokers — Leasing is firmly landlord-favorable; on the investment side, the widening bid-ask is your opening to bring priced-right necessity retail to buyers hunting for durable income.
Healthcare and Medical Office: The Lagging Class
Medical office was the exception to the improving trend. The most recent published data showed direct vacancy rising to 15.8% and net absorption turning negative, with the Q2 update still pending at the time of writing. The structural case for Phoenix medical office — aging demographics, the shift to outpatient care, and sticky clinical tenants — remains firmly in place, but the near-term read calls for pricing discipline, especially on off-campus assets.
What it means. For tenants — For medical practices, the tightest submarkets — Glendale, Scottsdale South, Tempe, and Arrowhead — leave little room for small-bay clinical users, so plan renewals and expansions well ahead; softer submarkets carry more availability. For investors — The one class showing near-term strain in the latest read — hold pricing discipline, favor Class A on- and near-campus space anchored by investment-grade health systems at 5.5–6.5% cap rates, and wait for the Q2 data before repricing. For brokers — Lead with the structural demand story — aging demographics, outpatient migration, and sticky clinical tenancy — while flagging the data lag; small-bay space in tight submarkets is the easiest match to make.
Local Arizona Impact: Why Greater Phoenix Keeps Growing
The reason all of this matters is that Phoenix isn’t a normal market — it’s one of the fastest-growing metros in the country. Maricopa County ranks among the national leaders for numeric population growth — third nationally among populous counties in the latest Census estimates. New rooftops drive retail demand, new employers drive office and industrial leasing, and an aging population drives medical office demand.
The semiconductor boom is the single biggest catalyst. Arizona ranks #1 nationally for semiconductor industry expansions, backed by more than $195 billion in announced international investment, and TSMC continues to expand its Valley campus. The state also opened a Taiwan Trade and Investment Service Center in Phoenix this year — reinforcing a supply chain that is reshaping the West Valley industrial corridors and pulling office, retail, and housing demand along with it.
You can see the ripple effects in projects like Halo Vista, the $7 billion, 2,300-acre innovation district being built adjacent to TSMC’s expanding campus. Layer in a Phoenix metro unemployment rate in the low-4% range and you have the demographic and employment engine that keeps the Phoenix commercial real estate market resilient even when national capital markets tighten.
National Impact: Phoenix Against the Backdrop
Nationally, commercial real estate is still working through the highest interest-rate environment in a generation. Office markets in many gateway cities remain stuck with structural vacancy, industrial is normalizing after a historic run, and retail is benefiting from years of limited new construction. Phoenix sits favorably against all three trends: its office recovery is ahead of many peer metros, its industrial demand is anchored by manufacturing rather than speculative logistics, and its retail supply is genuinely constrained.
The result is that national capital continues to view Greater Phoenix as a magnet market — a place drawing people, jobs, and companies out of higher-cost metros. That national interest is exactly why local pricing has stayed competitive even as cap rates drifted up across the country.
Key Risks to Watch
- Interest rates and financing. Elevated rates continue to pressure valuations and reduce buyer leverage across every asset class.
- Office durability. Q2’s positive absorption is one strong quarter against 23.3% vacancy. A single soft quarter would reopen questions about the recovery’s staying power.
- Industrial concentration. Glendale is driving the bulk of industrial demand while also carrying the largest construction pipeline — a single-submarket engine is also a single-submarket lease-up risk.
- Retail demand normalization. Vacancy is tight, but absorption is slowing sharply from last year’s pace, and cap rates are expanding.
- Medical office lag. The most recent MOB read was negative and the Q2 data is not yet out — underwriting off stale figures carries timing risk.
Key Opportunities
- Class A office with amenities. Well-located, amenitized Class A product with spec-suite programs in Scottsdale Airpark and the Camelback/Scottsdale cores is capturing the occupancy gains.
- Second-generation industrial. Well-located bulk product in the Goodyear, Glendale, and Chandler corridors at roughly $105–$150 per square foot fits a tightening supply picture.
- Necessity retail. Grocery-anchored neighborhood centers in high-growth East Valley and West Valley submarkets, where wider cap rates create a better entry point on durable income.
- Undersupplied medical office. Small-bay medical space in tight submarkets like Glendale, Scottsdale South, Tempe, and Arrowhead remains genuinely scarce.
The ICRE Perspective
Here is what we are seeing in the field that the headline numbers don’t fully capture. The most common mistake we hear right now is investors reading “cap rates are up” as “the market is weakening.” That’s backward. In the Phoenix commercial real estate market, wider cap rates paired with tightening vacancy and rising rents are not a warning — they are an entry point. You are being paid more yield to buy into fundamentals that are actually improving.
The opportunity investors are underestimating is the office recovery. After two years of avoiding the sector, most capital is still on the sidelines just as absorption turns positive and sublet space clears. The risk investors are underestimating is concentration — both in industrial (one submarket carrying the demand) and in assuming every retail deal deserves last year’s pricing. Our job is to help clients tell the difference between a market that is softening and a market that is simply repricing while it strengthens.
Takeaways for Tenants, Investors, and Brokers
- For tenants. Occupancy is tightening in industrial and retail and firming in office — lock in space and renewals in the tight classes now, and use the leverage that still exists in high-vacancy office and the softer industrial pockets.
- For investors. Read the half-year, not the quarter, and separate leasing strength from pricing — wider cap rates in retail and select industrial improve your entry basis on improving fundamentals, office is worth a fresh look while competition is thin, and MOB pricing should hold until the Q2 read lands.
- For brokers. The narrative that wins is “repricing while it strengthens” — help clients tell a softening market from a strengthening one that is simply repricing, and match each asset class’s distinct leasing-versus-capital dynamic to the right tenant or buyer.
Conclusion: A Market Repricing While It Strengthens
The strategic takeaway from the first half of 2026 is simple: the Phoenix commercial real estate market got stronger where it counts — occupancy, absorption, and rents — while capital markets grew more selective on price. That is a healthier setup than a market running hot on both, because it creates entry points for disciplined buyers.
Looking ahead, the drivers that made Phoenix a top-tier growth market — population gains, a historic semiconductor build-out, and constrained new supply — are only accelerating into the back half of the year. The action item is to get positioned now, while pricing is favorable and much of the capital is still cautious. The best way to start is with the data.
→ Download the latest Q2 2026 Phoenix CRE Pulse report from the ICRE Investment Team
Get the full asset-by-asset breakdown — office, industrial, retail, and healthcare — with submarket statistics, notable transactions, and our investment outlook for Greater Phoenix, all in one report.
Data sources: This analysis synthesizes ICRE Investment Team research with market data drawn from CBRE, Colliers, Cushman & Wakefield, JLL, Kidder Mathews, and Revista, alongside public data from the U.S. Census Bureau, the Greater Phoenix Economic Council, and the Arizona Commerce Authority. Figures reflect the most recent quarterly reports available at the time of writing.
How ICRE Can Help
At ICRE Investment Team, we specialize in helping investors, healthcare providers, and developers navigate the commercial real estate landscape — including the growing world of mixed-use healthcare assets. Whether you’re exploring your first medical office investment, evaluating a portfolio opportunity, or looking to understand how healthcare campuses fit into a broader CRE strategy, our team has the market knowledge and relationships to help you move forward with confidence.
Healthcare real estate is not a passive play. It requires the right guidance, the right location analysis, and the right understanding of tenant needs. That’s exactly what we bring to every transaction.
Ready to stay ahead of the market? Join thousands of investors and CRE professionals who get our latest insights, market updates, and investment opportunities delivered straight to their inbox.
Sign up for the ICRE Newsletter here →
Don’t miss the next opportunity — subscribe today and let the ICRE Investment Team be your guide in one of the most resilient and fast-growing sectors in commercial real estate.
Related reading: The Growing Demand for Mixed-Use Commercial Real Estate Healthcare Campuses
Small-bay medical space in tight submarkets like Glendale, Scottsdale South, Tempe, and Arrowhead remains genuinely scarce.
The ICRE Perspective
Here is what we are seeing in the field that the headline numbers don’t fully capture. The most common mistake we hear right now is investors reading “cap rates are up” as “the market is weakening.” That’s backward. In the Phoenix commercial real estate market, wider cap rates paired with tightening vacancy and rising rents are not a warning — they are an entry point. You are being paid more yield to buy into fundamentals that are actually improving.
The opportunity investors are underestimating is the office recovery. After two years of avoiding the sector, most capital is still on the sidelines just as absorption turns positive and sublet space clears. The risk investors are underestimating is concentration — both in industrial (one submarket carrying the demand) and in assuming every retail deal deserves last year’s pricing. Our job is to help clients tell the difference between a market that is softening and a market that is simply repricing while it strengthens.
Takeaways for Tenants, Investors, and Brokers
- For tenants. Occupancy is tightening in industrial and retail and firming in office — lock in space and renewals in the tight classes now, and use the leverage that still exists in high-vacancy office and the softer industrial pockets.
- For investors. Read the half-year, not the quarter, and separate leasing strength from pricing — wider cap rates in retail and select industrial improve your entry basis on improving fundamentals, office is worth a fresh look while competition is thin, and MOB pricing should hold until the Q2 read lands.
- For brokers. The narrative that wins is “repricing while it strengthens” — help clients tell a softening market from a strengthening one that is simply repricing, and match each asset class’s distinct leasing-versus-capital dynamic to the right tenant or buyer.
Conclusion: A Market Repricing While It Strengthens
The strategic takeaway from the first half of 2026 is simple: the Phoenix commercial real estate market got stronger where it counts — occupancy, absorption, and rents — while capital markets grew more selective on price. That is a healthier setup than a market running hot on both, because it creates entry points for disciplined buyers.
Looking ahead, the drivers that made Phoenix a top-tier growth market — population gains, a historic semiconductor build-out, and constrained new supply — are only accelerating into the back half of the year. The action item is to get positioned now, while pricing is favorable and much of the capital is still cautious. The best way to start is with the data.
→ Download the latest Q2 2026 Phoenix CRE Pulse report from the ICRE Investment Team
Get the full asset-by-asset breakdown — office, industrial, retail, and healthcare — with submarket statistics, notable transactions, and our investment outlook for Greater Phoenix, all in one report.
Data sources: This analysis synthesizes ICRE Investment Team research with market data drawn from CBRE, Colliers, Cushman & Wakefield, JLL, Kidder Mathews, and Revista, alongside public data from the U.S. Census Bureau, the Greater Phoenix Economic Council, and the Arizona Commerce Authority. Figures reflect the most recent quarterly reports available at the time of writing.
How ICRE Can Help
At ICRE Investment Team, we specialize in helping investors, healthcare providers, and developers navigate the commercial real estate landscape — including the growing world of mixed-use healthcare assets. Whether you’re exploring your first medical office investment, evaluating a portfolio opportunity, or looking to understand how healthcare campuses fit into a broader CRE strategy, our team has the market knowledge and relationships to help you move forward with confidence.
Healthcare real estate is not a passive play. It requires the right guidance, the right location analysis, and the right understanding of tenant needs. That’s exactly what we bring to every transaction.
Ready to stay ahead of the market? Join thousands of investors and CRE professionals who get our latest insights, market updates, and investment opportunities delivered straight to their inbox.
Sign up for the ICRE Newsletter here →
Don’t miss the next opportunity — subscribe today and let the ICRE Investment Team be your guide in one of the most resilient and fast-growing sectors in commercial real estate.
Related reading: The Growing Demand for Mixed-Use Commercial Real Estate Healthcare Campuses