

Phoenix commercial real estate market is sending mixed signals heading into 2027, and that is exactly why it deserves a closer look. On October 28, 2026, the CCIM Central Phoenix Chapter hosted Connor Devereux, Senior Director of Market Analytics at CoStar, for a property-by-property read on apartments, retail, office and industrial across the Valley.
The headline is not boom or bust. It is divergence. Long-term interest rates rose roughly 100 basis points this year, sales volume is cooling, and the apartment sector is being repriced in real time. At the same time, retail remains near record tightness, office demand is positive with no new supply, and industrial users are still competing for the largest, most modern buildings.
For investors, owners and tenants, that means the average no longer tells the story. The building, the submarket and the size segment now decide the outcome.
Five things every Phoenix investor should know from the luncheon:
- Rates are the swing factor. The 10-year Treasury climbed about a full point this year and bond-market volatility remains elevated, slowing deal decisions.
- Apartments are split in two. Operations are improving while capital markets are retreating, with multifamily sales down 23% and cap rates expanding.
- Retail is quietly outperforming. Vacancy near 4.5% sits well below pre-COVID levels, but gasoline prices and inflation are squeezing the shopper.
- Office scarcity is real at the top. No speculative office is under construction and sublease space has fallen more than 40% from its peak.
- Industrial is a barbell. Big-box and small-bay space is tight, while 100,000–250,000 SF product carries the vacancy.
Below, we walk through each sector, pair CoStar’s slides with our own Q3 2026 Phoenix CRE Pulse data, and explain what it means for your next move.
Current Market Context: Higher Rates, Higher Volatility
Devereux opened with capital markets because that is where the year changed. The 10-year Treasury rose roughly 100 basis points during 2026, peaking above 5.2% on CoStar’s chart before easing. It has not stayed down: the yield closed back above 5% on October 28, and futures markets are now pricing a strong chance of another Fed hike in December.
Expectations flipped from flat or lower rates to tighter policy. The Federal Reserve raised its target range 25 basis points to 3.75%–4.00% in September, and bond volatility, measured by the ICE BofAML MOVE Index, has stayed above its early-year lows. When the cost of capital is uncertain, buyers and lenders slow down.
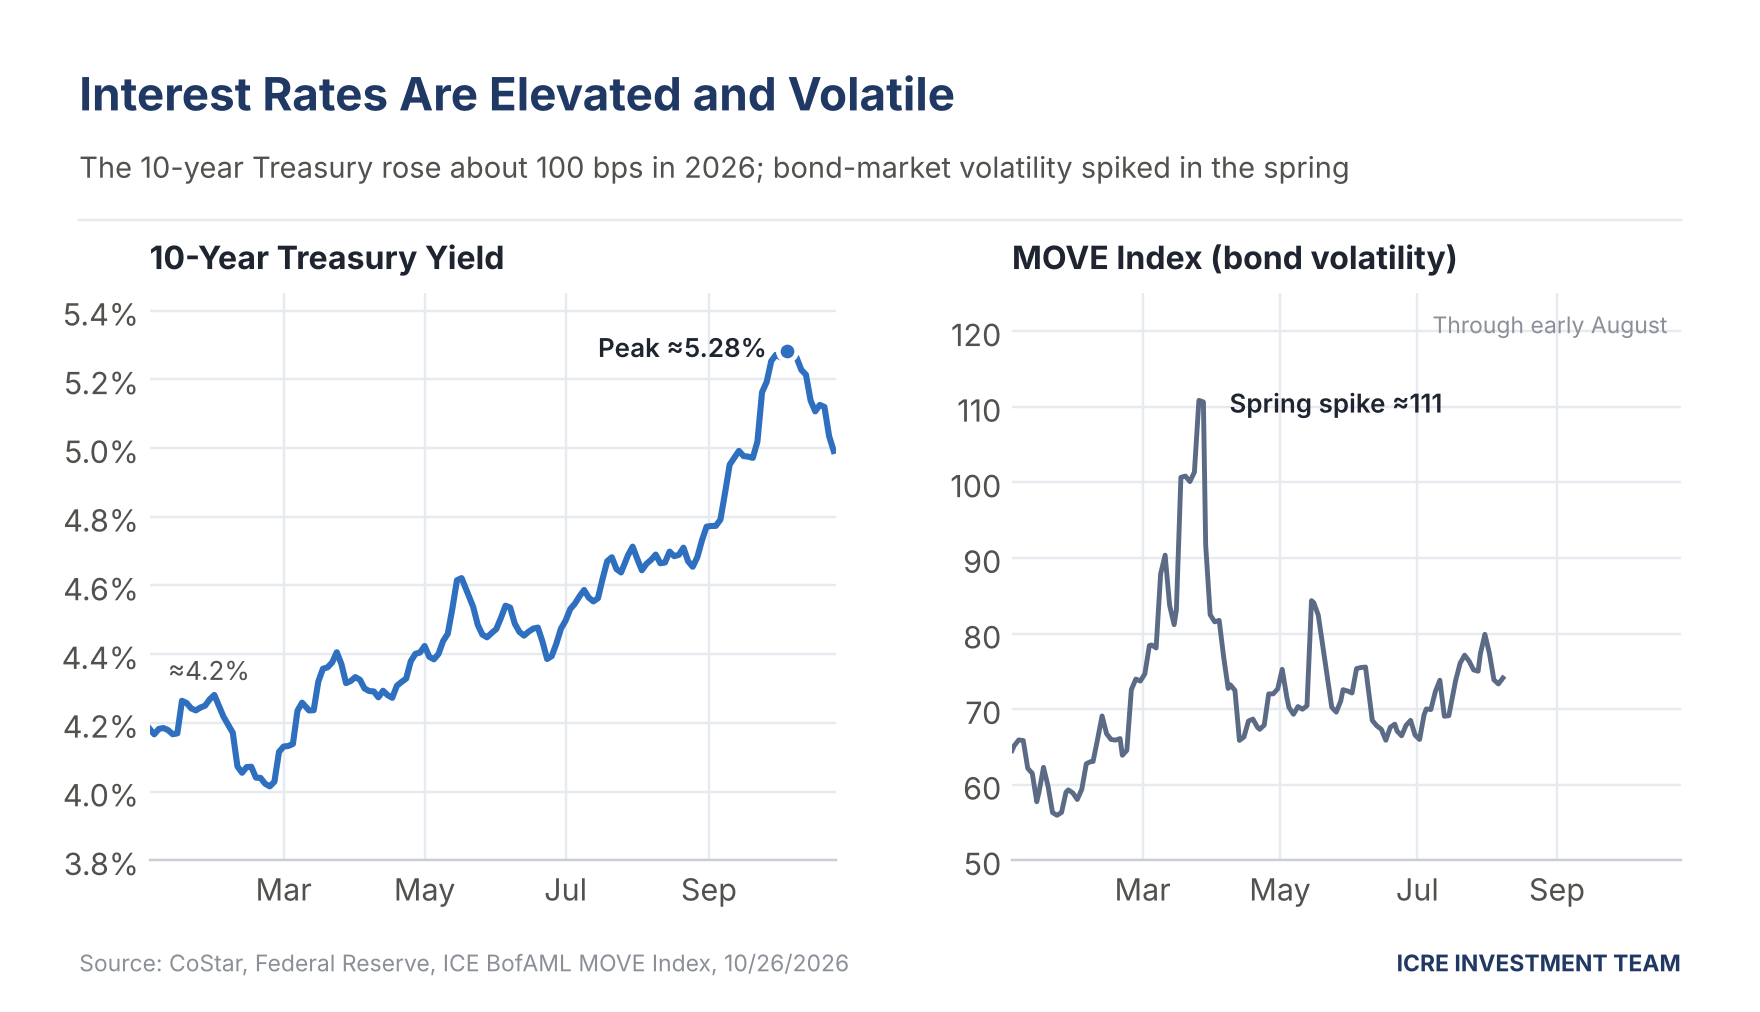
The 10-year Treasury rose about 100 bps in 2026 while bond volatility stayed elevated. Chart recreated by ICRE from CoStar data; values approximate.
The result shows up in transaction counts. Greater Phoenix annual sales volume is down about 6% year over year, though it remains roughly 40% above the 2023–2024 trough. Devereux cautioned that higher rates have weakened hopes for an especially strong fourth quarter.
The mix of what trades has also changed. From 2015 to 2019, apartments made up roughly half of Greater Phoenix sales volume. Today industrial is the largest slice, a structural shift that reflects both Phoenix’s new role in national supply chains and the disruption hitting multifamily and office pricing.
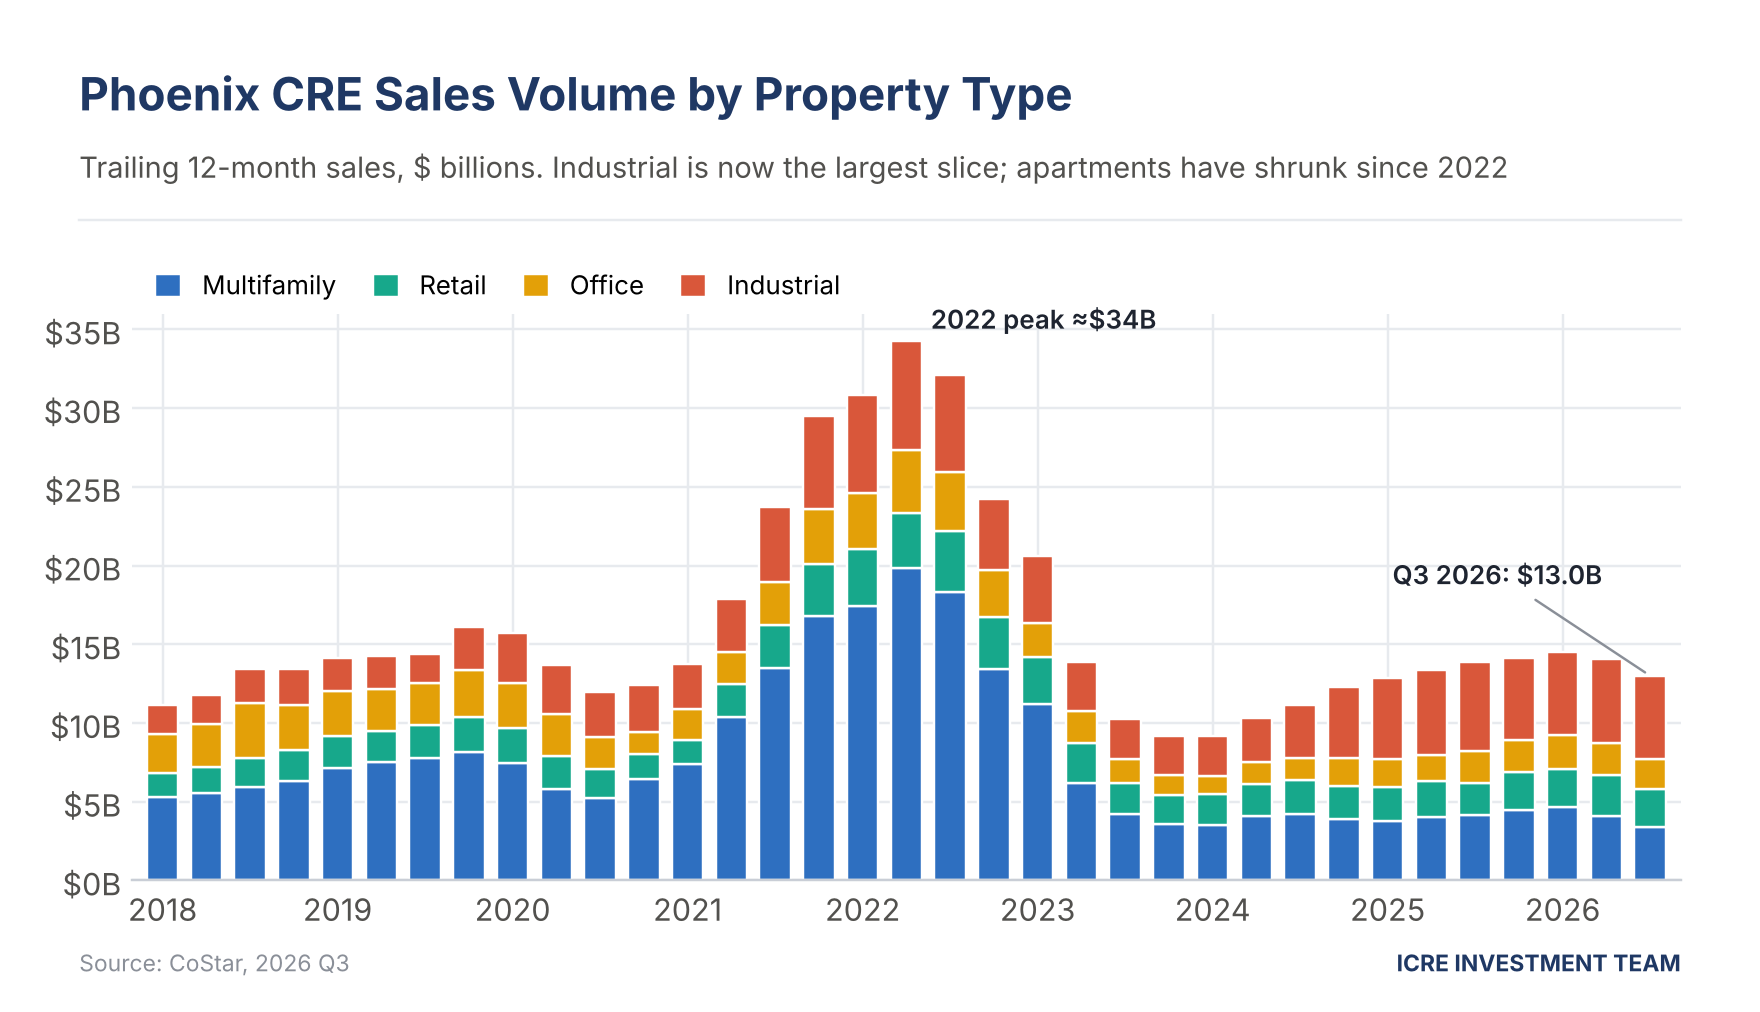
Industrial now leads Phoenix sales volume; multifamily has shrunk sharply since 2022. Chart recreated by ICRE from CoStar data; interim quarters approximate.
Phoenix Commercial Real Estate Market Outlook: What CoStar Told the CCIM Luncheon
The clearest way to read the Phoenix commercial real estate market today is sector by sector. Each asset class is responding to the same rate environment in a different way, and the gaps between them are wider than at any point since before the pandemic.
Multifamily: Fundamentals Up, Capital Markets Down
Multifamily lost the most momentum. Trailing 12-month apartment sales fell 23% to $3.4 billion, while retail and office were essentially flat and industrial rose 2% to $5.3 billion. One market participant told Devereux of roughly 50 basis points of cap-rate expansion in 90 days and pricing declines of 10% to 15%, with deals stalling or being repriced.
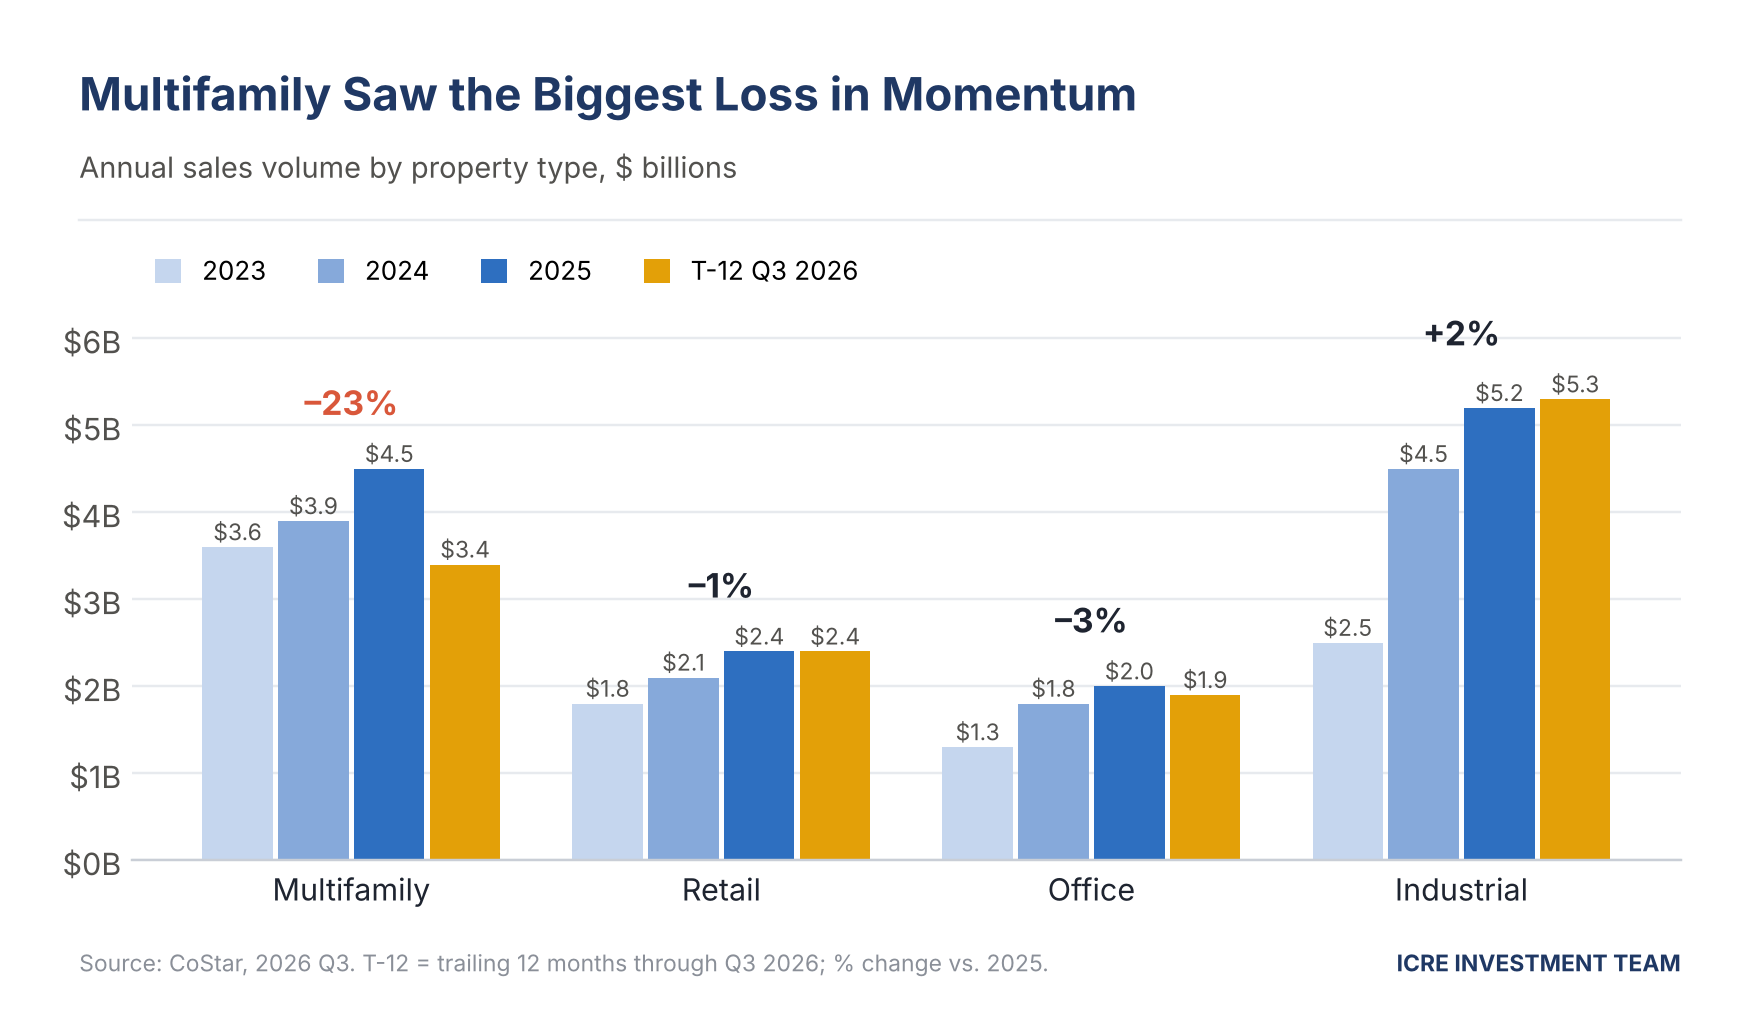
Multifamily sales fell 23%; retail, office and industrial were flat to slightly up. Chart recreated by ICRE from CoStar data.
Financing is tightening too. The October 2026 NMHC Quarterly Survey of Apartment Market Conditions posted an equity financing index of 17 and a debt financing index of 10, both far below the breakeven level of 50, meaning most respondents saw capital get harder to find over the prior three months.
The unusual part is that operations are improving. After roughly 84,000 net new units met only about 50,000 units of demand during the building wave, 2026 demand is again outpacing supply. Vacancy has eased from above 12% to about 10.5%, and annual rent growth improved from –2.9% at the end of 2025 to about –0.9%. Concessions remain heavy: about three-quarters of communities offer a discount, some now 10 weeks or more of free rent. CoStar’s base case calls for about 1.5% asking-rent growth in 2027, with an upside case near 2.8%, as deliveries keep falling.
Retail: Tight Space, Stretched Shoppers
Phoenix retail vacancy sits near 4.5%, compared with roughly 7% before COVID, and our Q3 Pulse shows a similar 4.4%. Store openings have outpaced closings for two years, and year-to-date openings through October are running ahead of 2025. New construction remains low, so quality, well-located space is hard to find.
Consumer spending is still the engine. CoStar’s slide of the U.S. Census Bureau retail report showed total retail sales up 6.7% year over year, ahead of inflation, with gains spread across most categories.
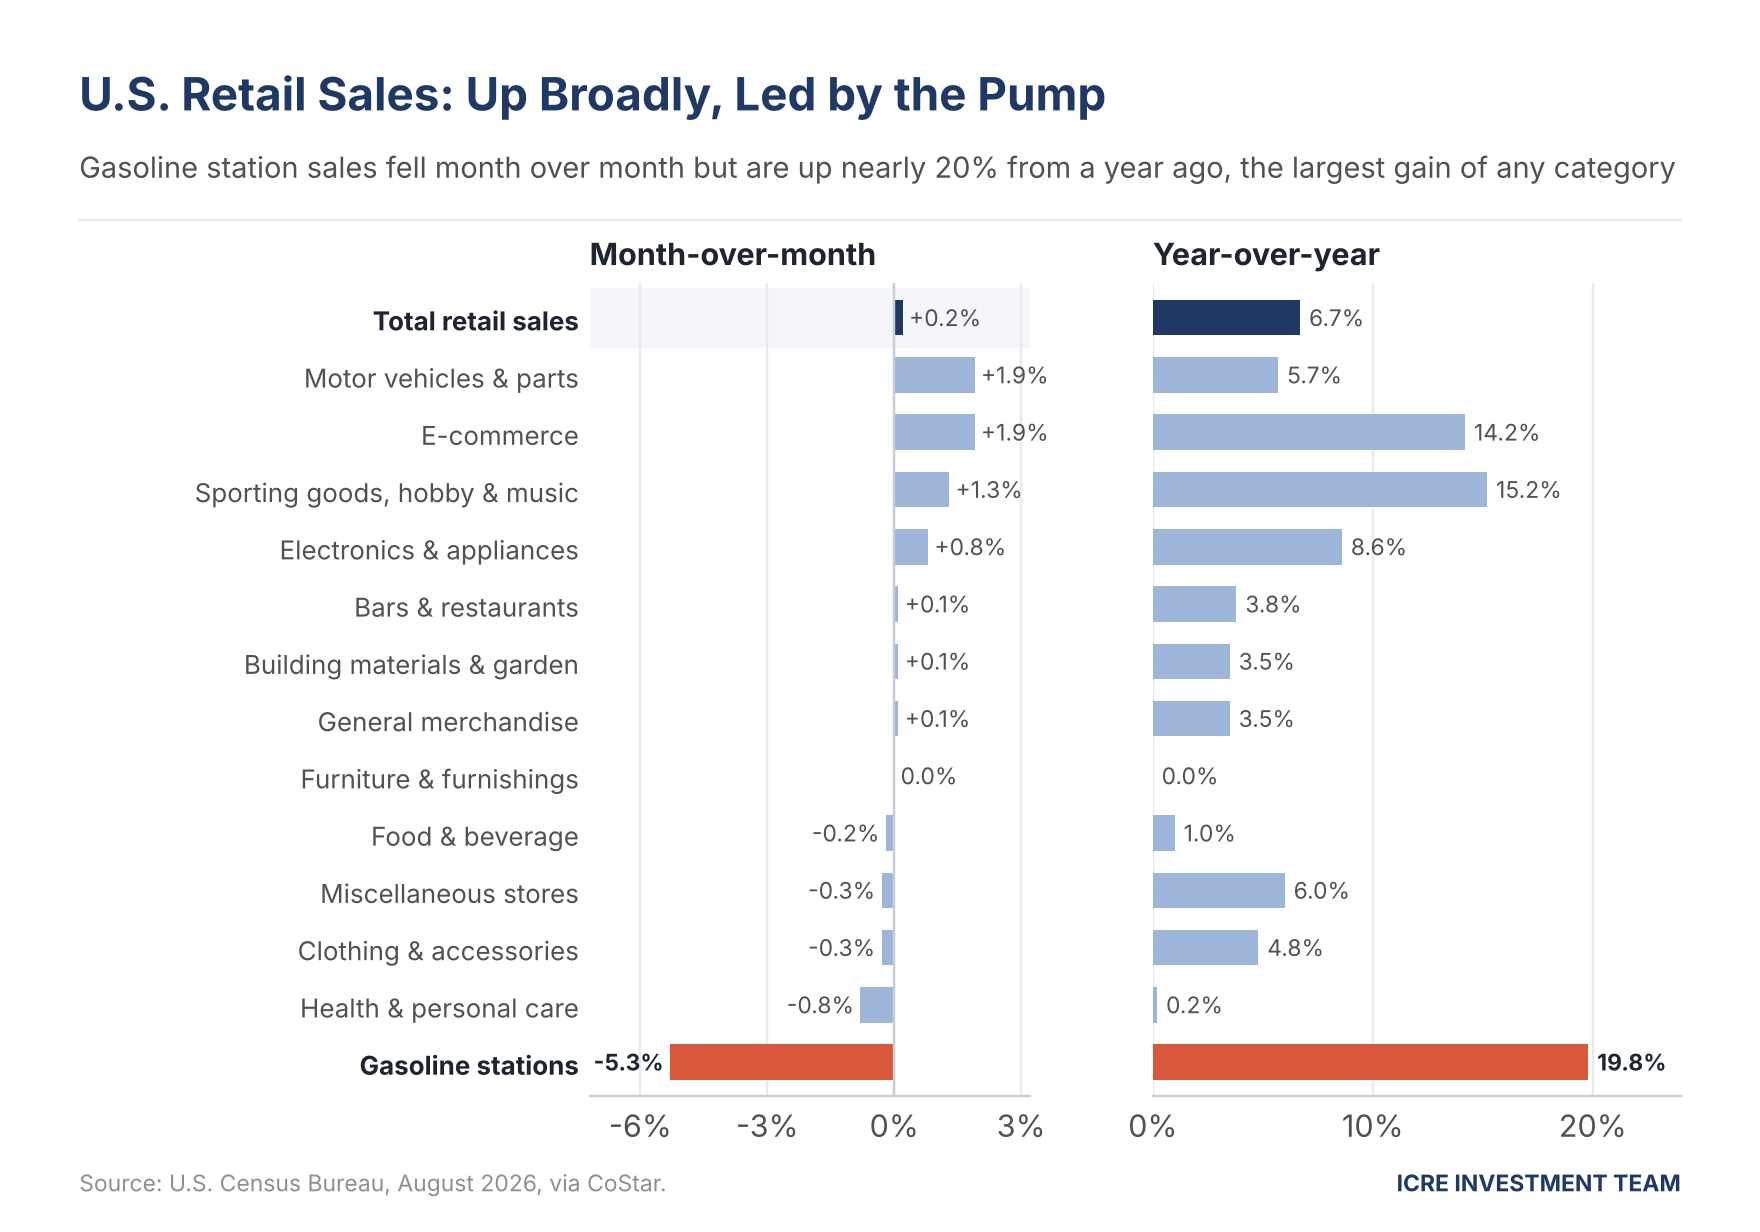
Gasoline stations: –5.3% month over month, but +19.8% year over year. Chart recreated by ICRE from U.S. Census Bureau data via CoStar.
The gasoline line deserves a closer look. Gas station sales were up nearly 20% from a year earlier, the biggest annual jump of any category, even as they dipped 5.3% month over month on CoStar’s slide. That is not Americans driving 20% more. It is the price at the pump. One analysis of the August data found regular gasoline rising from $3.93 to $4.06 a gallon in the month with volumes roughly flat, and prices kept climbing to about $4.32 by mid-September.
This matters for retail real estate in two ways. First, gasoline inflates the headline retail sales number, so real spending is weaker than 6.7% suggests. Second, every extra dollar spent at the pump is a dollar not spent at restaurants, salons or soft-goods retailers. Notice that health and personal care barely grew year over year (+0.2%) on the same slide, while needs-based fuel spending surged.
Wages are losing the race. September consumer prices rose 3.7% from a year earlier, led by a 9.1% monthly jump in gasoline, and real average hourly earnings fell 0.7% year over year. CoStar’s chart shows the inflation line crossing above wage growth in 2026 for the first time since 2022. Credit-card and student-loan delinquencies are also rising, though mortgage delinquency remains low.
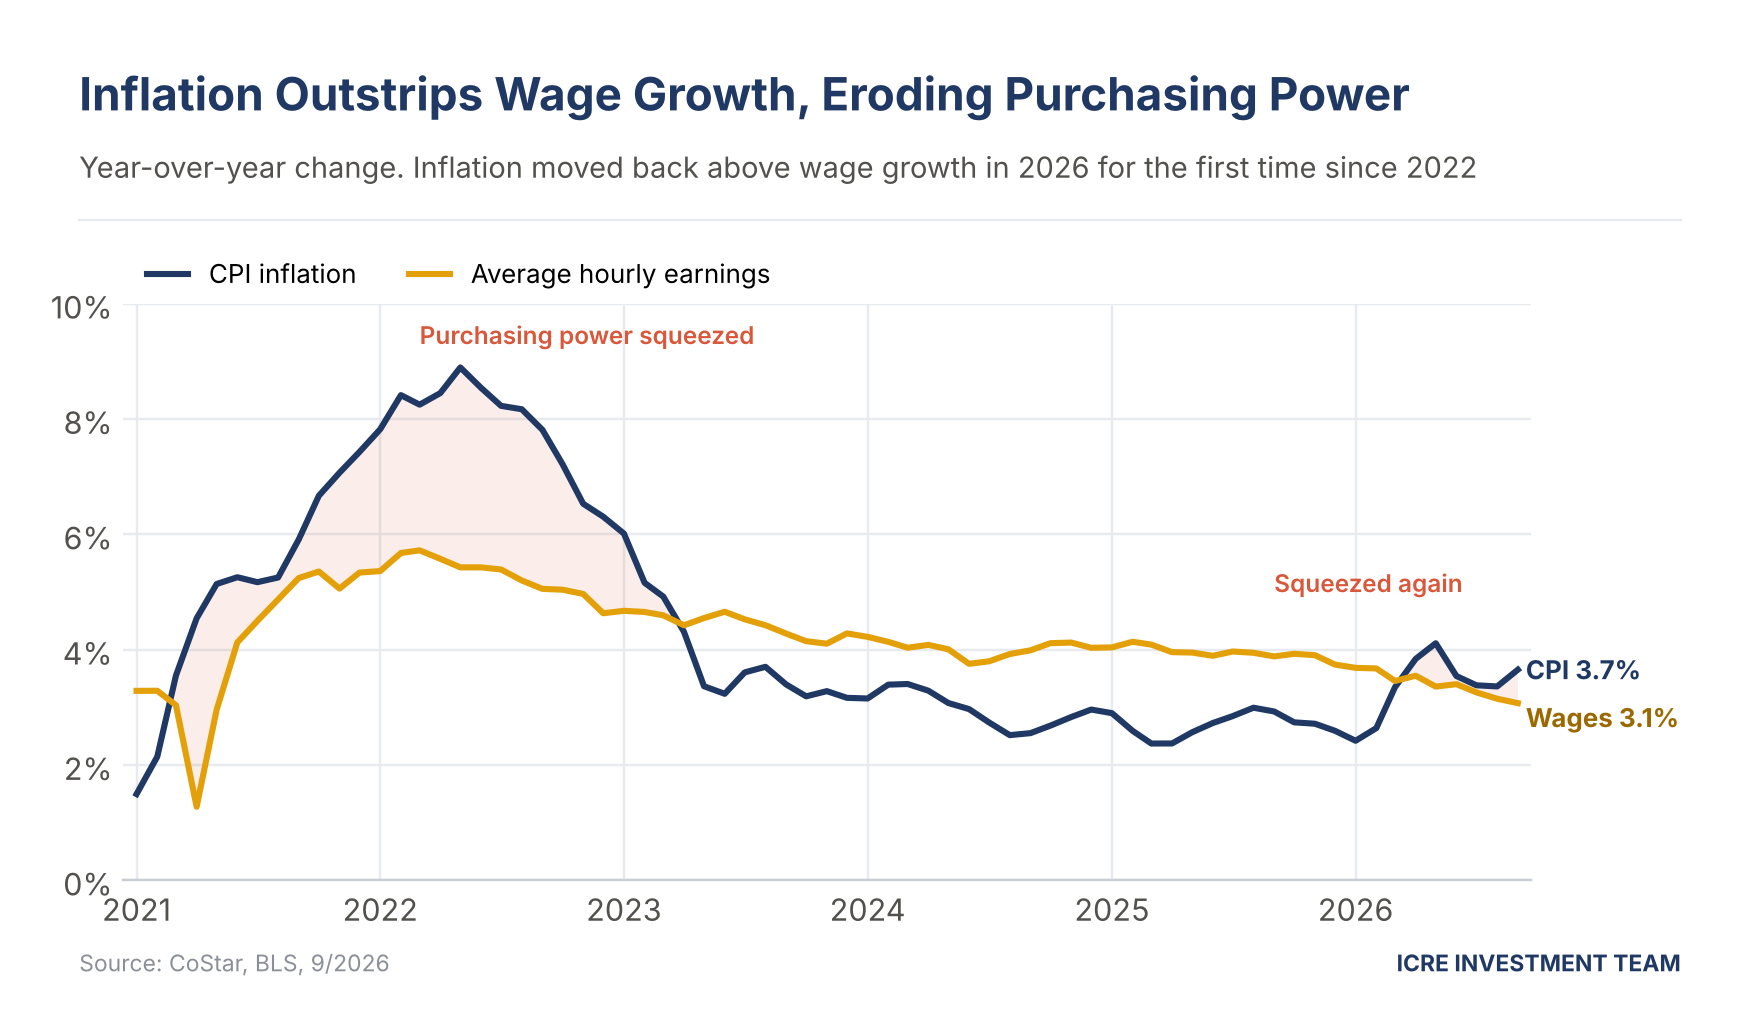
Inflation has moved back above wage growth, eroding purchasing power. Chart recreated by ICRE from CoStar/BLS data; values approximate.
Office: Positive Demand, Falling Inventory
Phoenix office absorption turned positive in 2025 and stayed positive through 2026. Much of the activity is still a transfer between buildings, as tenants downsize or trade up, so high-vacancy buildings keep losing occupants while well-leased buildings gain them.
Supply is the bullish piece. There is no speculative non-medical office under construction anywhere in the Valley, and older vacant buildings are being demolished or converted, including to industrial use. Total office inventory has actually shrunk over the past year.
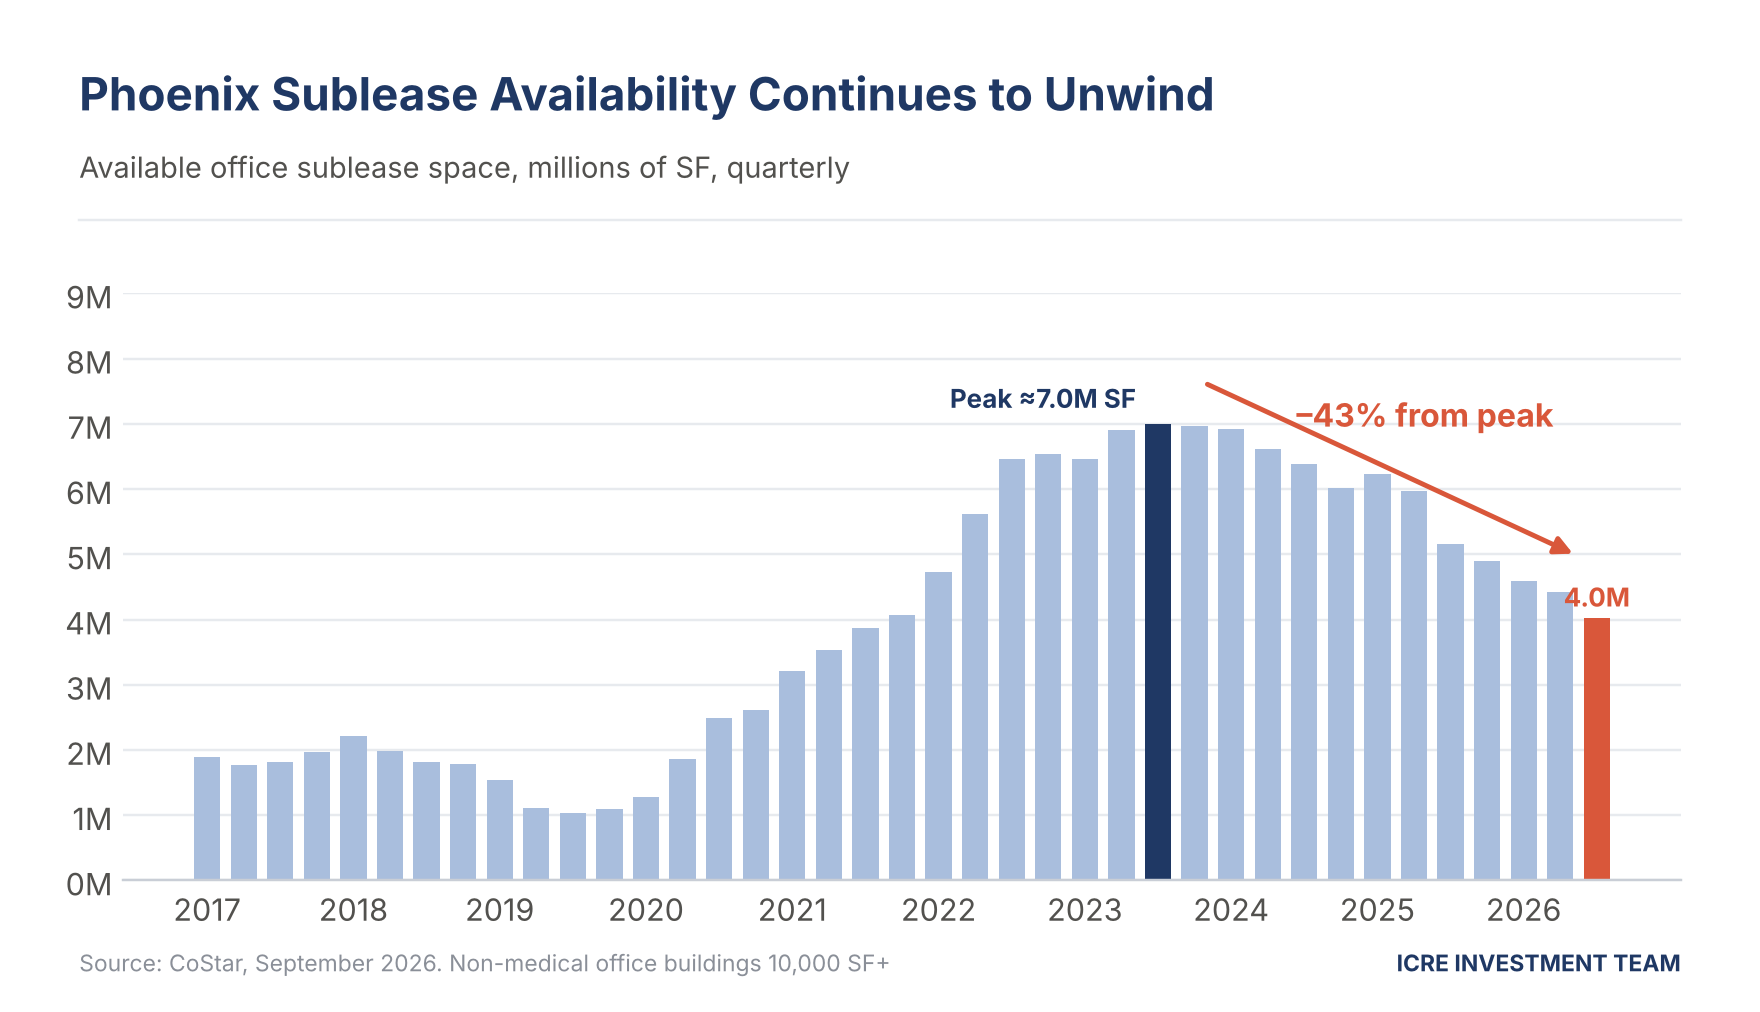
Phoenix office construction has effectively stopped. Chart recreated by ICRE from CoStar data; values approximate.
Sublease space is also unwinding. Available sublease space peaked near 7 million square feet and has fallen about 43% since, removing a large pool of discounted competition. Trophy Class A buildings in Scottsdale, Tempe and the Camelback Corridor are approaching 10% vacancy, with prime asking rents above $60 per square foot and some above $70.
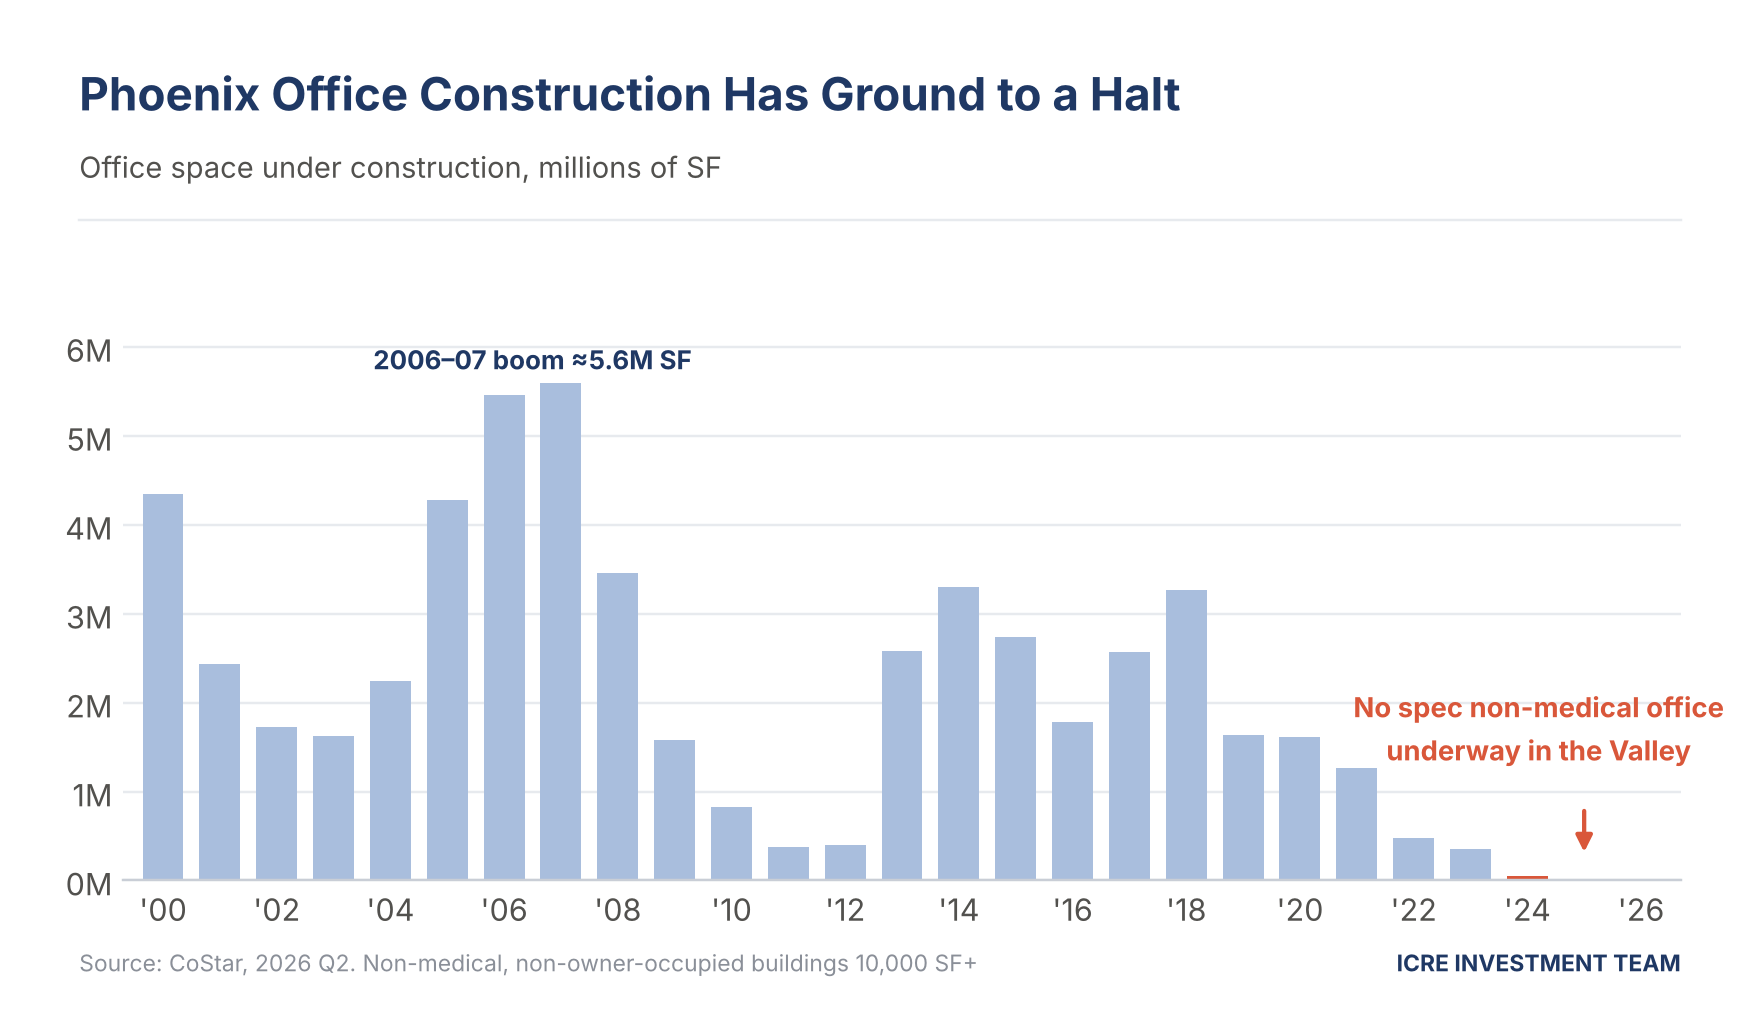
Sublease availability is down 43% from its peak. Chart recreated by ICRE from CoStar data; values approximate.
Our Q3 Pulse data puts metro-wide total vacancy at 23.7% with average asking rents near $31.66 per square foot, a reminder that the recovery is happening at the top first. Devereux expects demand to flow next into well-located Tier 2 Class A buildings, while Class B owners will need meeting space, food and beverage, and spec suites to compete.
Industrial: Structurally Strong, Unevenly Distributed
Phoenix industrial demand rests on deeper roots than it did before COVID: semiconductor investment, aerospace and defense, advanced manufacturing and its logistics reach into Southern California. Buildings over 250,000 square feet accounted for nearly 90% of trailing 12-month demand.
That creates a barbell. Direct availability above 500,000 square feet is extremely tight, and a user needing 1 million square feet cannot find an existing building in the Valley today. Small-bay space under 50,000 square feet is also tight. The pressure sits in the middle, 100,000 to 250,000 square feet, where new construction has pushed vacancy up.
The pipeline has fallen from more than 50 million square feet to about 20 million, still roughly triple pre-COVID norms, and about half is unleased. Our Q3 Pulse shows total vacancy of 11.5% and asking rents near $1.18 per square foot per month, up about 5% from a year ago. The West Valley, Loop 303, Deer Valley and TSMC-adjacent North Phoenix remain strongest, while the Mesa Gateway area faces ongoing lease-up.
Local Arizona Impact: Growth Is Slowing, Not Stopping
The Phoenix commercial real estate market still benefits from population and job growth that outpaces most of the country, but the tailwind is softer than in 2015–2019. The Phoenix metro reached about 5.23 million residents, and University of Arizona forecasters project population growth near 1.5% in 2026 with job growth around 1.0% to 1.1% in 2026 and 2027.
Job growth has cooled. Metro nonfarm employment was up 0.9% year over year in August, with unemployment at 4.9% versus 4.3% a year earlier. One standout: health care jobs rose 3.8%, the fastest of any major sector and a direct driver of medical office demand.
Economic development continues to anchor the long view. The Arizona Commerce Authority reported a record of more than $109 billion in investment and about 26,225 projected jobs in fiscal 2026, and TSMC’s Arizona commitment has grown to $265 billion with additional fabs underway. Those projects support industrial demand in the North and West Valley, plus the housing, retail and medical services that follow new workers.
For healthcare real estate, our core focus, the Q3 2026 Phoenix CRE Pulse shows medical office direct vacancy of 15.2%, no new deliveries for a second straight quarter, and about 405,000 square feet under construction. Needs-based healthcare tenants are less exposed to gasoline-driven pullbacks than discretionary retail, which makes well-located medical space in Gilbert, Chandler, Queen Creek and the West Valley a relative safe harbor in a choppier economy.
National Impact
Phoenix is not navigating this alone. The same rate and inflation pressures are hitting every U.S. market. Nationally, CMBS delinquency reached 8.02% in September, the highest since late 2020, with office loans at 12.16% and industrial at just 1.14%. That spread mirrors what Devereux described locally: capital is flowing toward industrial and away from the sectors with the most operating disruption.
What sets Phoenix apart is that its forecast still beats the national average. CoStar expects Phoenix retail and industrial rent growth to slow in 2027 but remain above the U.S. rate, and Phoenix apartments are expected to return to positive rent growth as supply drops faster than in many Sun Belt peers.
Key Risks
- Rates stay higher for longer. A December hike or another leg up in the 10-year would keep cap rates rising and transaction volume subdued.
- The consumer cracks. Fuel costs, negative real wages and rising card delinquencies are the main threat to Phoenix’s retail story.
- Mid-size industrial oversupply. Owners of 100,000–250,000 SF buildings, especially in lease-up submarkets, face longer downtime and more concessions.
- Apartment refinancing stress. Owners with loans maturing into a weak financing market may be forced to sell into falling prices.
- Office obsolescence. Commodity Class B and C buildings without amenities will keep losing tenants to stronger properties.
Key Opportunities
- Multifamily acquisitions at reset pricing. Buyers with patient capital can acquire improving assets at 10–15% discounts before rent growth turns positive.
- Office repositioning. With no new supply, renovated spec suites and amenitized buildings in strong submarkets can win share, and some vacant offices are candidates for medical conversion.
- Big-box and small-bay industrial. The two ends of the barbell remain the tightest segments in the market.
- Needs-based retail and medical. Grocery-anchored, service and healthcare tenancies hold up best when gasoline squeezes discretionary budgets.
The ICRE Perspective
What we are seeing in the field matches CoStar’s data: buyers want certainty, and they will pay for it. Well-leased medical office, small-bay industrial and grocery-anchored retail are drawing the deepest buyer pools. Anything with lease-up risk is being underwritten with wider spreads and longer downtime.
What investors may be missing is the gasoline signal. A 20% annual jump in gas station sales looks like strength on a headline, but it is really a tax on household budgets. Landlords with heavy discretionary retail exposure should review tenant sales and credit now, while vacancy is still low and leverage still favors owners.
The opportunity being underestimated is the multifamily divergence. When fundamentals and capital markets move in opposite directions, pricing tends to overshoot. Investors who can close without relying on peak leverage may look back on late 2026 and 2027 as an attractive entry point.
The risk being underestimated is that Phoenix’s growth premium is narrowing. Job growth near 1% supports the market, but it no longer covers mistakes. Location, building quality and tenant credit matter more than they have in a decade.
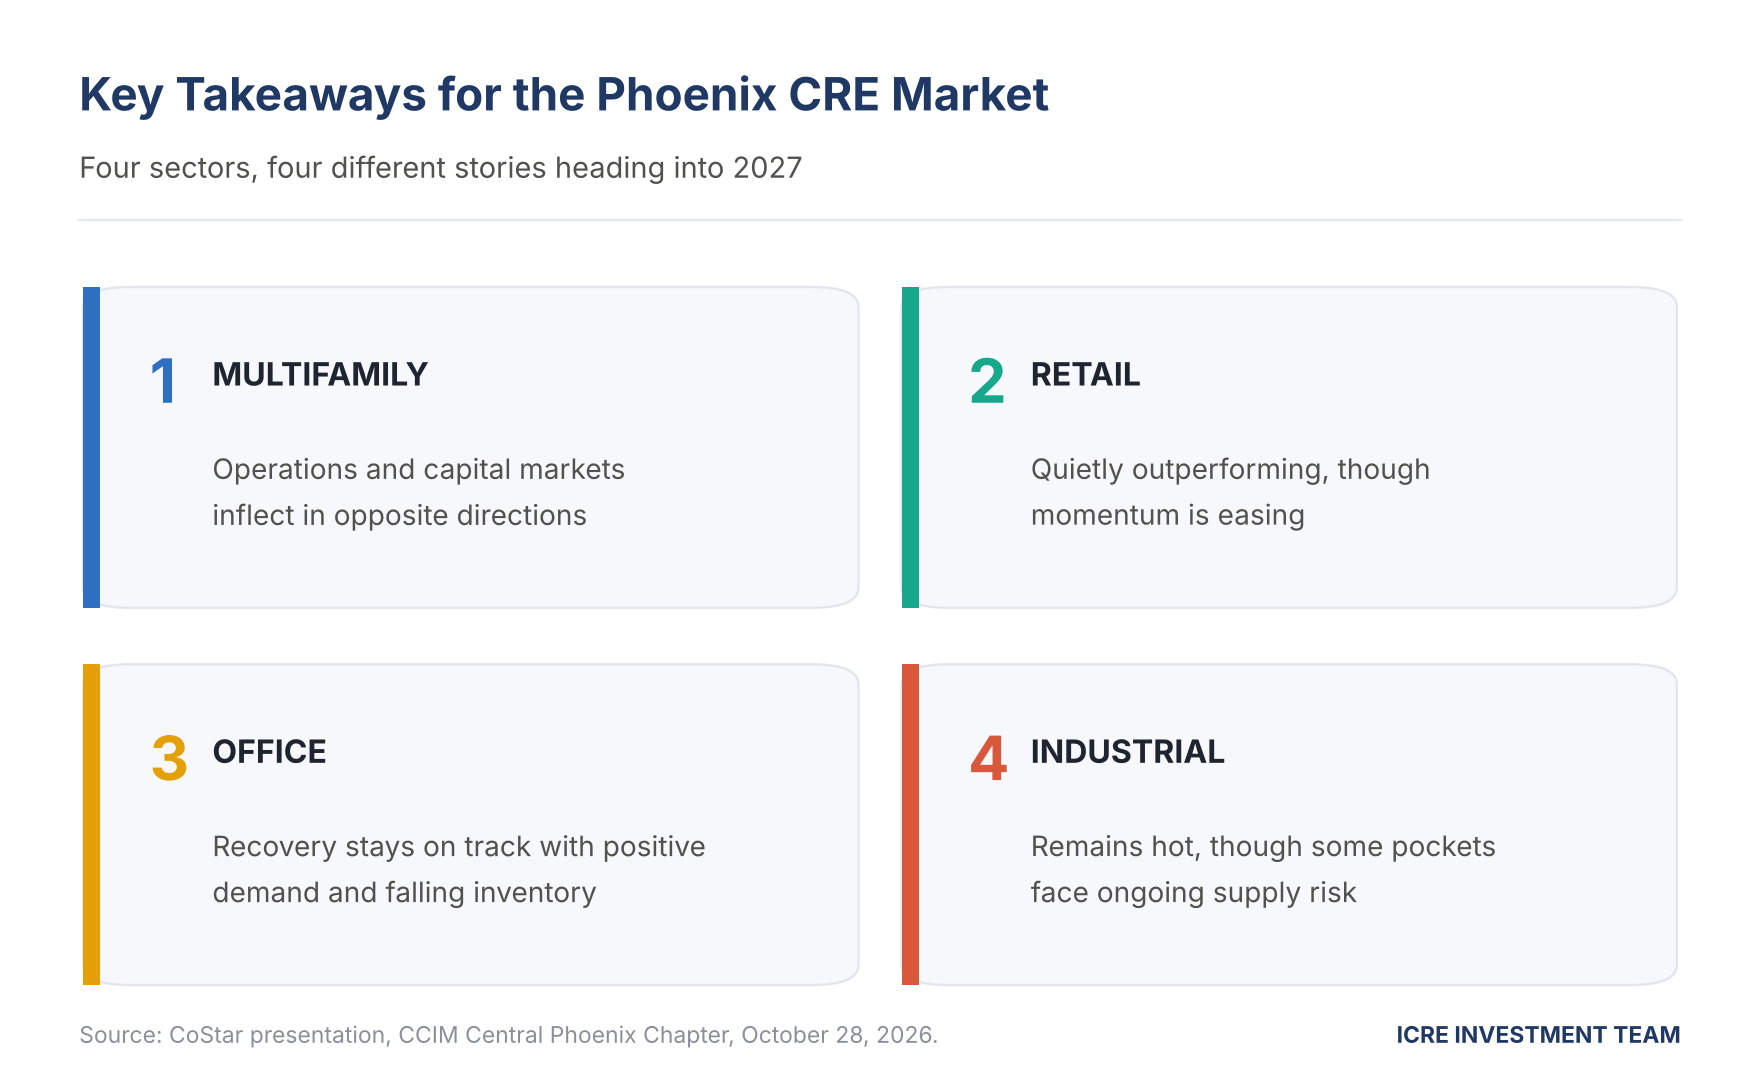
CoStar’s four takeaways for the Phoenix CRE market, presented at the CCIM Central Phoenix Chapter, October 28, 2026.
Investor Takeaways
- Underwrite to today’s rates. Model a 10-year Treasury near 5% and stress-test exit cap rates higher.
- Segment before you generalize. Building size, class and submarket now drive returns more than the asset class label.
- Watch the pump. Fuel prices are a leading indicator for discretionary retail tenant health.
- Lean into scarcity. Prime office, big-box industrial and medical office benefit from limited new supply.
- Be ready for multifamily dislocation. Line up equity now so you can act when sellers face refinancing deadlines.
Conclusion
The strategic takeaway from the CCIM luncheon is that the Phoenix commercial real estate market is no longer one market. It is four sectors, dozens of submarkets and several size segments moving at different speeds, all under the weight of higher rates and pricier fuel.
Looking into 2027, CoStar expects gradual normalization: apartment rents turning positive, retail staying tight, office recovering on positive demand and shrinking supply, and industrial absorbing its remaining pipeline. The biggest risk is a sharper consumer slowdown driven by inflation and energy costs.
Your action item: review every asset and every lease in your portfolio against these sector-level trends before year-end, and identify where today’s Phoenix commercial real estate market offers you leverage as a tenant, a buyer or an owner.
How ICRE Can Help
At ICRE Investment Team, we specialize in helping investors, healthcare providers, and developers navigate the commercial real estate landscape — including our latest quarterly read on the Phoenix market. Whether you’re exploring your first medical office investment, evaluating a portfolio opportunity, or looking to understand how healthcare campuses fit into a broader CRE strategy, our team has the market knowledge and relationships to help you move forward with confidence.
Healthcare real estate is not a passive play. It requires the right guidance, the right location analysis, and the right understanding of tenant needs. That’s exactly what we bring to every transaction.
Ready to stay ahead of the market? Join thousands of investors and CRE professionals who get our latest insights, market updates, and investment opportunities delivered straight to their inbox.
Sign up for the ICRE Newsletter here →
Don’t miss the next opportunity — subscribe today and let the ICRE Investment Team be your guide in one of the most resilient and fast-growing sectors in commercial real estate.
Related reading: Q3 2026 – Phoenix Commercial Real Estate Market Report
Sources
- CoStar, Phoenix commercial real estate market presentation by Connor Devereux, CCIM Central Phoenix Chapter luncheon, October 28, 2026 (slides sourced to CoStar, Federal Reserve, ICE BofAML MOVE Index, U.S. Census Bureau and BLS)
- ICRE Investment Team, Q3 2026 Phoenix CRE Pulse (download)
- U.S. Census Bureau, Advance Monthly Sales for Retail and Food Services
- Piedmont Crescent Capital, Retail Sales, August 2026: Broad and Real, Except at the Pump
- KPMG, September 2026 CPI: Energy Adds Fuel to a Well-Kindled Fire
- 24/7 Wall St., The 10-Year Treasury Yield Just Jumped Back Above 5%
- Calculated Risk, NMHC: Apartment Market Conditions Weaken in October Survey
- National Multifamily Housing Council, Quarterly Survey of Apartment Market Conditions (October 2026)
- U.S. Bureau of Labor Statistics, Phoenix Area Economic Summary
- University of Arizona Eller College, Phoenix MSA Third Quarter 2026 Forecast Flash
- KJZZ, Arizona Saw More Than $109 Billion in Economic Investments in Fiscal 2026
- AZ Big Media, TSMC Arizona Accelerates Production Timeline as Earnings Soar
- Scotsman Guide (Trepp data), CMBS Delinquencies Reach Highest Level Since 2020