

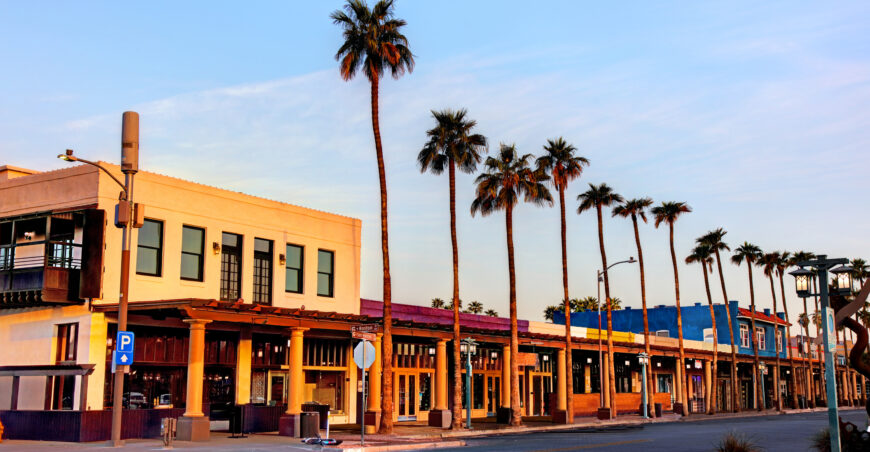
Phoenix retail real estate is officially a landlord’s market because it has quietly become one of the best-performing property sectors in the Valley, and most owners have not fully priced in how much leverage has shifted their way. A few years ago, the conventional wisdom held that retail was the riskiest corner of commercial real estate — overbuilt, over-exposed to e-commerce, and structurally in decline. That story has not aged well in Arizona. Today, the Valley’s shopping centers, pad sites, and single-tenant buildings are running tighter than almost any other commercial property type in the metro.
The numbers make the case. Phoenix retail vacancy held at 4.5% in Q2 2026 — one of the lowest rates of any property type in the metro — while asking rents jumped nearly 7% year over year to $1.73 per square foot per month, well ahead of national retail rent growth. The supply that would normally cool things off is shrinking rather than growing: space under construction fell to 2.7 million square feet, down roughly 23% year over year. And the leverage is most concentrated where growth is fastest, with the East Valley and Scottsdale posting stabilized vacancy at or below 7%.
What we are seeing in the field is a classic landlord’s market taking shape. When a well-located center loses a tenant, the backfill conversation is measured in weeks, not quarters. For owners, that combination has quietly flipped the negotiating table — and the strategic question is no longer whether to hold Phoenix retail real estate, but how to price renewals, structure new leases, and underwrite acquisitions in a market where tenants have few alternatives. The sections below break down why it is happening and how long it is likely to last.
Current Market Context
Nationally, retail is the quiet standout of the commercial real estate world. U.S. retail availability sat at just 4.9% in Q1 2026, and construction completions fell to 4.7 million square feet — the lowest quarterly total since CBRE began tracking the metric in 2005. Average asking rents still rose 2.4% year over year to $24.59 per square foot, supported by three straight quarters of positive net absorption.
The reason is simple. Developers spent the last 15 years building very little new retail while demand slowly caught up to supply. As low availability and minimal construction now constrain absorption across the country, the tightest conditions are showing up in fast-growing Sun Belt metros — and few are growing faster than Phoenix.
Phoenix Retail Real Estate: Why 2026 Is a Landlord’s Market
Phoenix retail real estate is tighter than the national market on almost every measure that matters. Metro vacancy held at 4.5% in Q2 2026, essentially unchanged year over year, after touching a record low of roughly 4.3% earlier in the cycle. For context, that is well below the 8% range the market carried heading into the last downturn. When vacancy runs this low, landlords stop competing on concessions and start competing tenants against each other for the same space.
Rent growth tells the same story. Average asking rents climbed nearly 7% year over year to $1.73 per square foot per month — roughly triple the national pace. And demand is real, not speculative: the Valley absorbed about 2.5 million square feet over a trailing 12-month stretch, reversing the negative absorption seen a couple of years ago as off-price retailers, grocers, and service tenants backfilled space.
Here is the part that makes this a durable landlord’s market rather than a temporary blip. The supply that would normally cool things off is disappearing. Space under construction dropped to 2.7 million square feet in Q2 2026, down nearly 23% from a year earlier. Deliveries did tick up as previously started projects finished, but the forward pipeline is thinning. Less new product plus steady demand equals sustained pricing power for existing owners.
Capital is taking notice. On the investment side, single-tenant net lease cap rates in Phoenix held near 6.80% in early 2026 even as the supply of available net-lease product tightened, and retail loan volume in the metro roughly doubled year over year — a clear sign that lenders and buyers see retail as financeable and defensible again.
Local Arizona Impact: Where the Leverage Is Strongest
Not all Phoenix submarkets are created equal, and the leverage is most pronounced where rooftops and incomes are growing fastest. The East Valley — Chandler and Gilbert — along with Scottsdale are the strongest-performing retail submarkets in the Valley, with stabilized vacancy at or below 7%. These are the trade areas where a departing tenant is a leasing opportunity, not a problem.
Leasing activity backs that up. Recent deals include Goodwill taking roughly 52,000 square feet in the East Valley, Center Court Pickleball signing for nearly 37,000 square feet in Scottsdale, and Nordstrom Rack renewing nearly 35,000 square feet in North Scottsdale. Notice the mix — value retail, experiential concepts, and off-price national credit are all expanding here at the same time.
The demand driver underneath all of it is population growth. Metro Phoenix added 59,065 residents in the latest Census estimate, ranking fourth nationally for numeric growth, and it remains one of the fastest-growing large metros in the country. Every new household in Queen Creek, San Tan Valley, Gilbert, and the far West Valley creates incremental demand for grocery, medical, dining, and service retail — the exact tenant categories filling Phoenix centers today. Looking forward, that in-migration, combined with a shrinking construction pipeline, points to continued rent growth and tight vacancy across the metro’s retail corridors well into the back half of the decade.
National Impact
Phoenix is not an outlier so much as the sharp end of a national trend. Retail construction completions across the U.S. hit a 20-year low, and Sun Belt markets are leading the country in both absorption and what little construction is happening. Capital that once chased industrial and multifamily is rediscovering retail precisely because the supply picture is so favorable to owners.
For Arizona, that national capital rotation matters. It means more competition for well-located Phoenix retail assets, tighter cap rates on quality product, and a deeper buyer pool when it is time to sell. The flip side is that acquisition opportunities are becoming harder to find and win, which raises the value of local relationships and off-market access.
Key Risks
A landlord’s market is not a riskless market. The most important variable is tenant health. Low vacancy is only valuable if tenants can pay escalating rents, and national retail has still seen bankruptcy-driven store closures nudge availability up slightly. Owners should underwrite tenant credit and sales performance, not just headline occupancy.
Second, rent growth of nearly 7% is not a permanent condition. As new — if limited — deliveries stabilize and rents reset higher, expect the pace to moderate toward a more sustainable 2.5% to 3.5% range. Underwriting acquisitions on the assumption that 7% rent growth continues indefinitely is a mistake. Third, construction and operating costs, insurance premiums, and financing at 6% to 7% all compress the returns that low vacancy would otherwise deliver.
Key Opportunities
For owners and investors who read the market correctly, the opportunities are concrete. Renewals are the most immediate: in a market this tight, below-market in-place rents represent embedded upside that can be captured at each lease expiration without meaningful re-tenanting risk.
Value-add plays on older, well-located centers — re-tenanting weak boxes with service, medical, and experiential users — are working because those tenant categories are the ones expanding. And single-tenant net lease assets offer passive investors durable, financeable income in a sector where new supply is structurally constrained. These are precisely the smaller CRE deals that are transacting faster than institutional assets right now. The common thread is that scarcity favors whoever already owns quality space in the path of growth.
The ICRE Perspective
From our vantage point working retail deals across the Valley, the biggest disconnect right now is between how owners feel about retail and what the numbers actually say. Many owners still carry a defensive, last-cycle mindset — pricing renewals conservatively and offering concessions out of habit — when the data says they hold the leverage. We are regularly seeing quality space lease faster and at higher rents than owners expect going in.
The opportunity investors are missing is on the buy side. Because retail carries lingering reputational baggage, some well-located Phoenix centers and pad sites are still trading at more forgiving pricing than the fundamentals justify — especially compared to industrial or multifamily. That gap is closing as national capital rotates in, but it has not fully closed yet. The risk we would flag is complacency on tenant quality: in a landlord’s market it is tempting to fill space with whatever tenant appears, but credit and sales durability are what protect income when the cycle eventually softens.
Investor Takeaways
- Reprice renewals to market. With vacancy near 4.5% and rents up nearly 7%, below-market in-place leases are embedded upside — capture it at every expiration.
- Prioritize the East Valley and Scottsdale. Chandler, Gilbert, and Scottsdale offer the strongest fundamentals, with stabilized vacancy at or below 7%.
- Buy the scarcity, not the hype. A shrinking construction pipeline makes existing, well-located retail more valuable — but underwrite to normalized 2.5%-3.5% rent growth, not 7%.
- Underwrite tenant credit carefully. Low vacancy only pays if tenants can sustain escalating rents. Favor service, medical, grocery-anchored, and off-price national credit.
- Move on off-market opportunities. As national capital rotates into Sun Belt retail, relationships and off-market access will separate winning buyers from the rest.
Conclusion
The strategic takeaway is straightforward: Phoenix retail real estate has become a genuine landlord’s market, and the conditions creating it — record-low vacancy, mid-single-digit rent growth, a shrinking construction pipeline, and relentless population growth — are structural rather than temporary. Owners hold pricing power they have not enjoyed in over a decade.
Looking ahead, expect vacancy to stay anchored near or below 5% and rent growth to moderate toward a healthier, more sustainable pace as the market matures. That is a good outcome for owners — durable income with less volatility. The action item is to stop managing retail defensively. Audit your rent roll for below-market leases, pressure-test tenant credit, and evaluate whether now is the moment to acquire, reposition, or recapitalize before national capital fully closes the pricing gap.
How ICRE Can Help
At ICRE Investment Team, we specialize in helping investors, healthcare providers, and developers navigate the commercial real estate landscape — including the growing world of mixed-use healthcare assets. Whether you’re exploring your first medical office investment, evaluating a portfolio opportunity, or looking to understand how healthcare campuses fit into a broader CRE strategy, our team has the market knowledge and relationships to help you move forward with confidence.
Healthcare real estate is not a passive play. It requires the right guidance, the right location analysis, and the right understanding of tenant needs. That’s exactly what we bring to every transaction.
Ready to stay ahead of the market? Join thousands of investors and CRE professionals who get our latest insights, market updates, and investment opportunities delivered straight to their inbox.
Sign up for the ICRE Newsletter here →
Don’t miss the next opportunity — subscribe today and let the ICRE Investment Team be your guide in one of the most resilient and fast-growing sectors in commercial real estate.
Related reading: Why Smaller CRE Deals Are Moving Faster Than Institutional Assets